OpenSearch Dashboards quickstart guide
This quickstart guide provides demonstrations to help you quickly explore OpenSearch Dashboards applications. You can use this guide either in your own environment or in the OpenSearch Playground to explore the following features:
- Adding sample data: Use preloaded visualizations and dashboards to explore OpenSearch Dashboards before adding your own data.
- Using the Discover tool: Run one-time data queries to gain insights.
- Using the Dashboards application: Create a collection of data visualizations.
Prerequisites
To follow this guide, you need access to one of the following OpenSearch installations:
-
Access the OpenSearch Playground online. The online OpenSearch Playground is read-only.
-
Install OpenSearch and OpenSearch Dashboards images on a local machine using the Installation quickstart.
-
Choose from other installation methods. See Install and configure OpenSearch and Installing OpenSearch Dashboards.
Accessing OpenSearch Dashboards
Once the OpenSearch and OpenSearch Dashboards processes are running, view the OpenSearch Dashboards application by opening your browser and going to the dashboard URL:
-
https://playground.opensearch.org/app/home#/ for the OpenSearch Playground.
-
http://localhost:5601/app/home#/ (without the Security plugin) or https://localhost:5601/app/home#/ (with the Security plugin) for a local installation.
The OpenSearch Dashboards default view is shown in the following image.
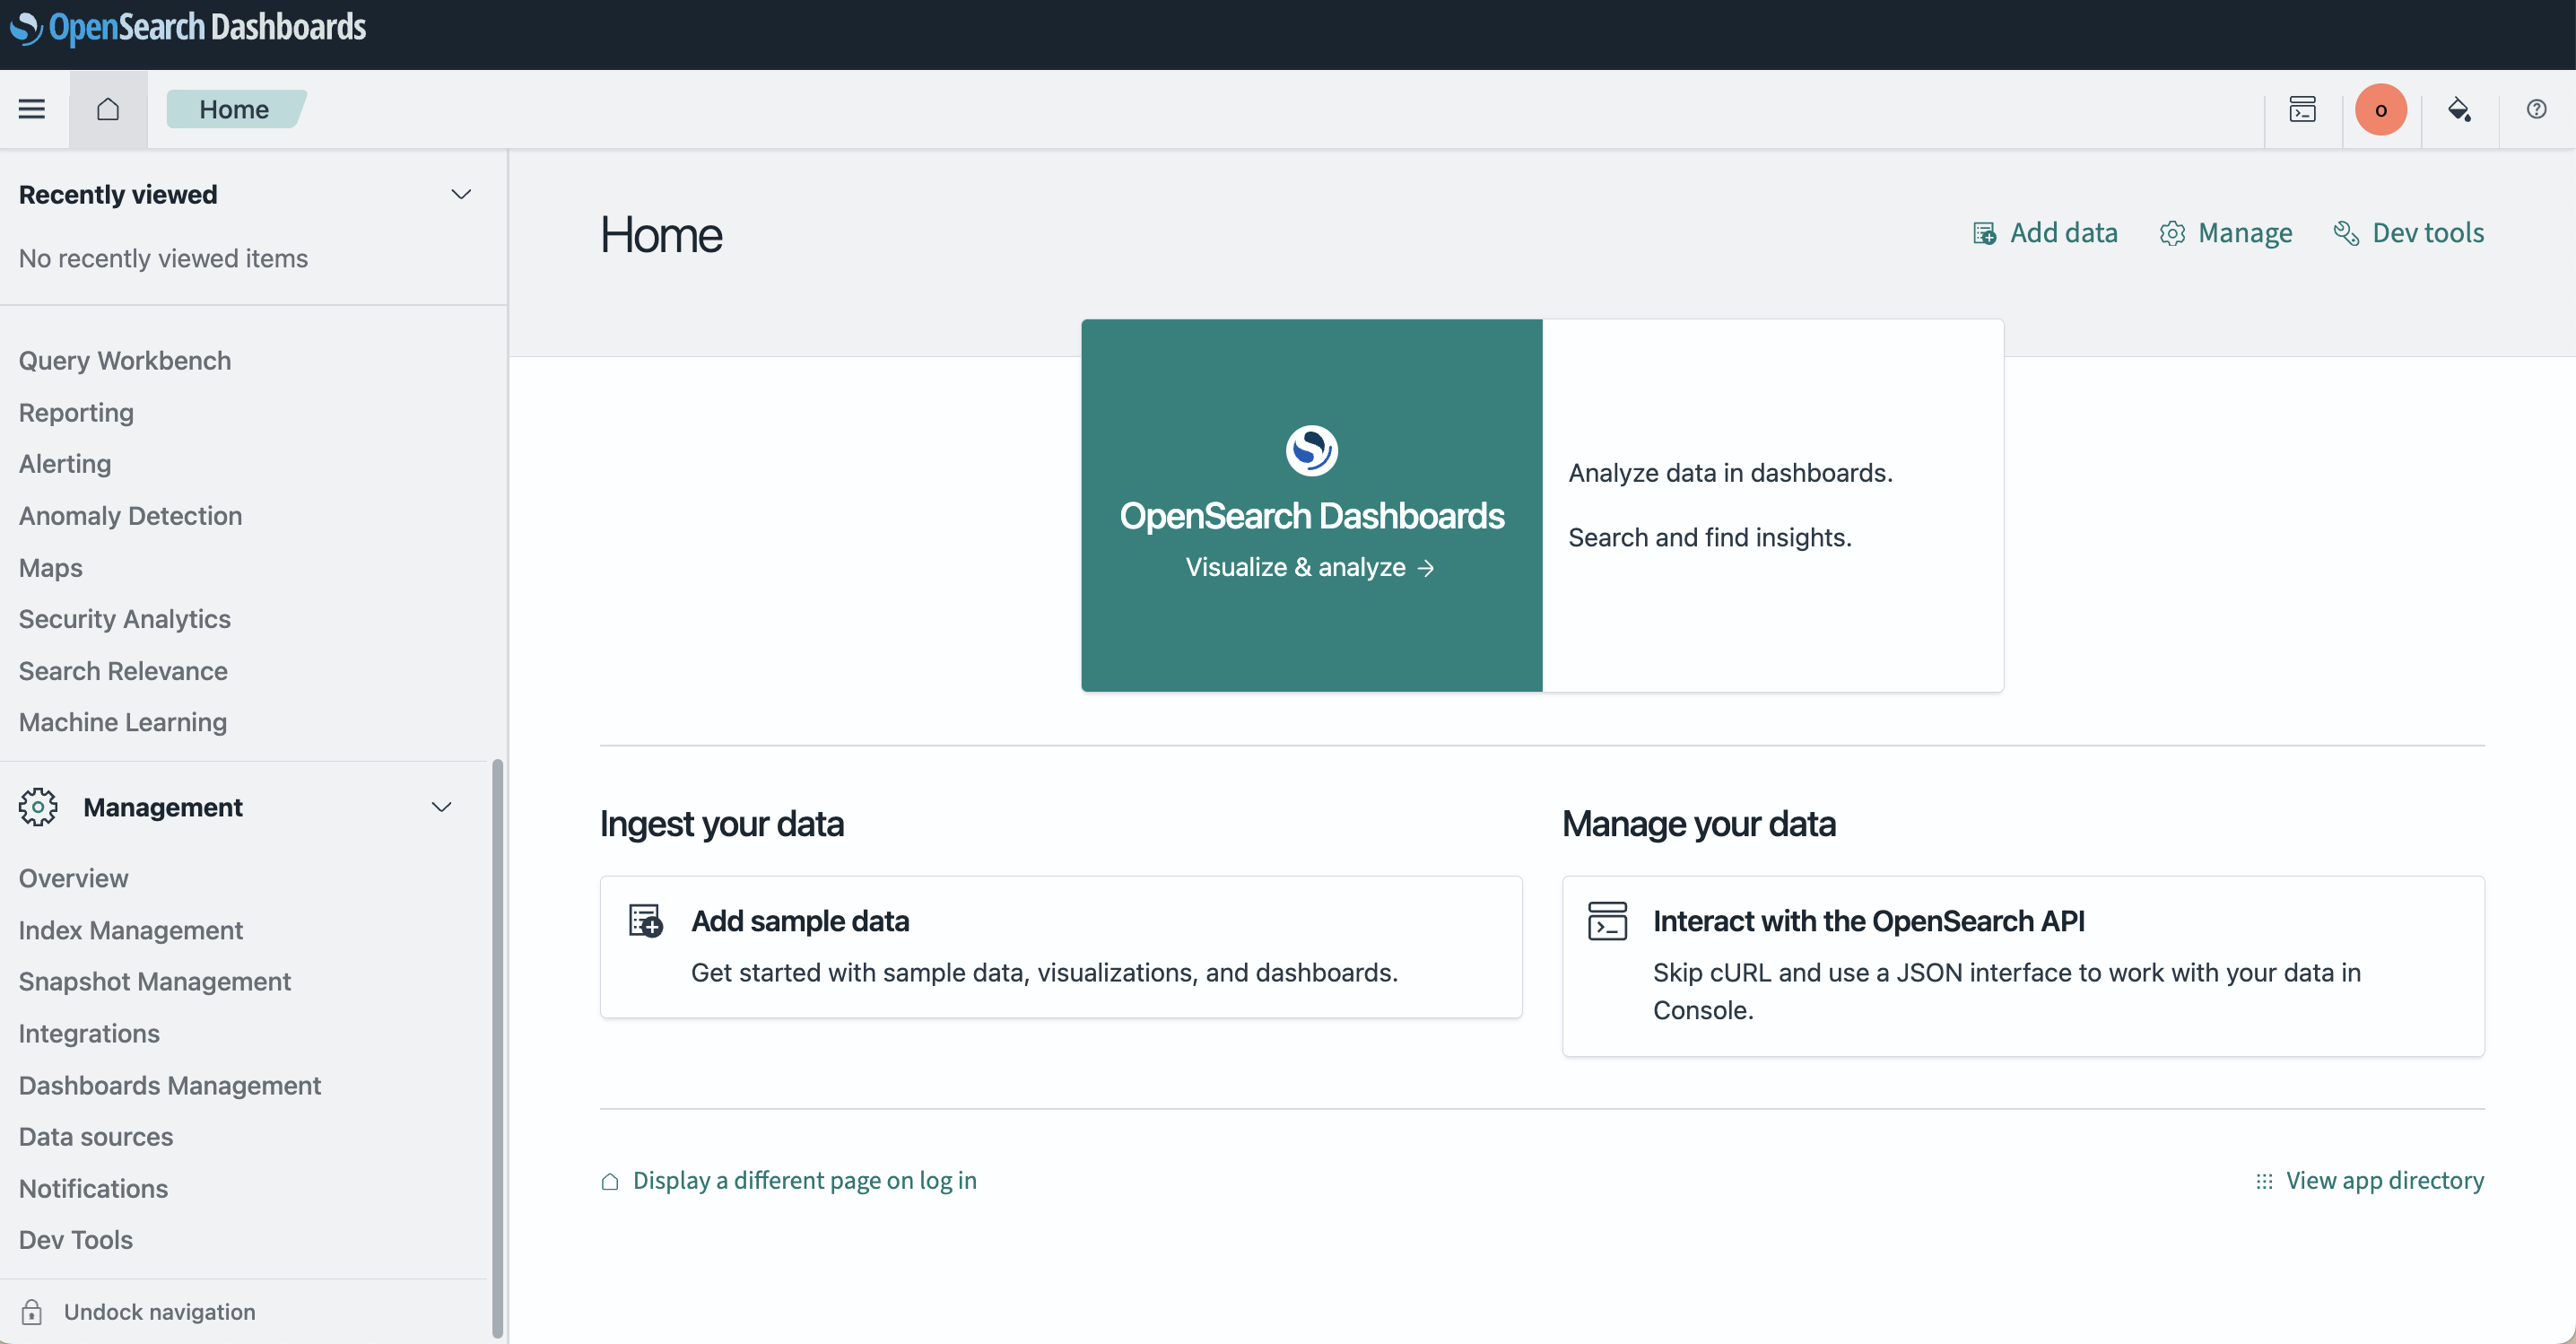
The demonstrations on this page use the Sample flight data dataset. If you’ve installed a local OpenSearch Dashboards instance, access OpenSearch Dashboards and add the sample data as described in Adding sample data.
Hiding the navigation panel
To enlarge the main page panel, you can undock and hide the navigation panel.
Undocking and hiding the navigation panel
To undock and hide the navigation panel, follow these steps:
-
Select
 (dock) Undock navigation at the bottom of the navigation panel.
 -
Select the
 (menu) icon or
  (cross) to the right of the menu.
Unhiding and docking the navigation panel
To unhide and dock the navigation panel, follow these steps:
-
Select the
(menu) icon. -
Select
 (undock) Dock navigation at the bottom of the navigation panel.
Adding sample data
If you’ve installed a local OpenSearch Dashboards instance, add one or more sample datasets, follow these steps:
-
On the OpenSearch Dashboards home page, choose Add sample data. Or on any page, choose
 (add data) Add data from the upper-right toolbar.
 -
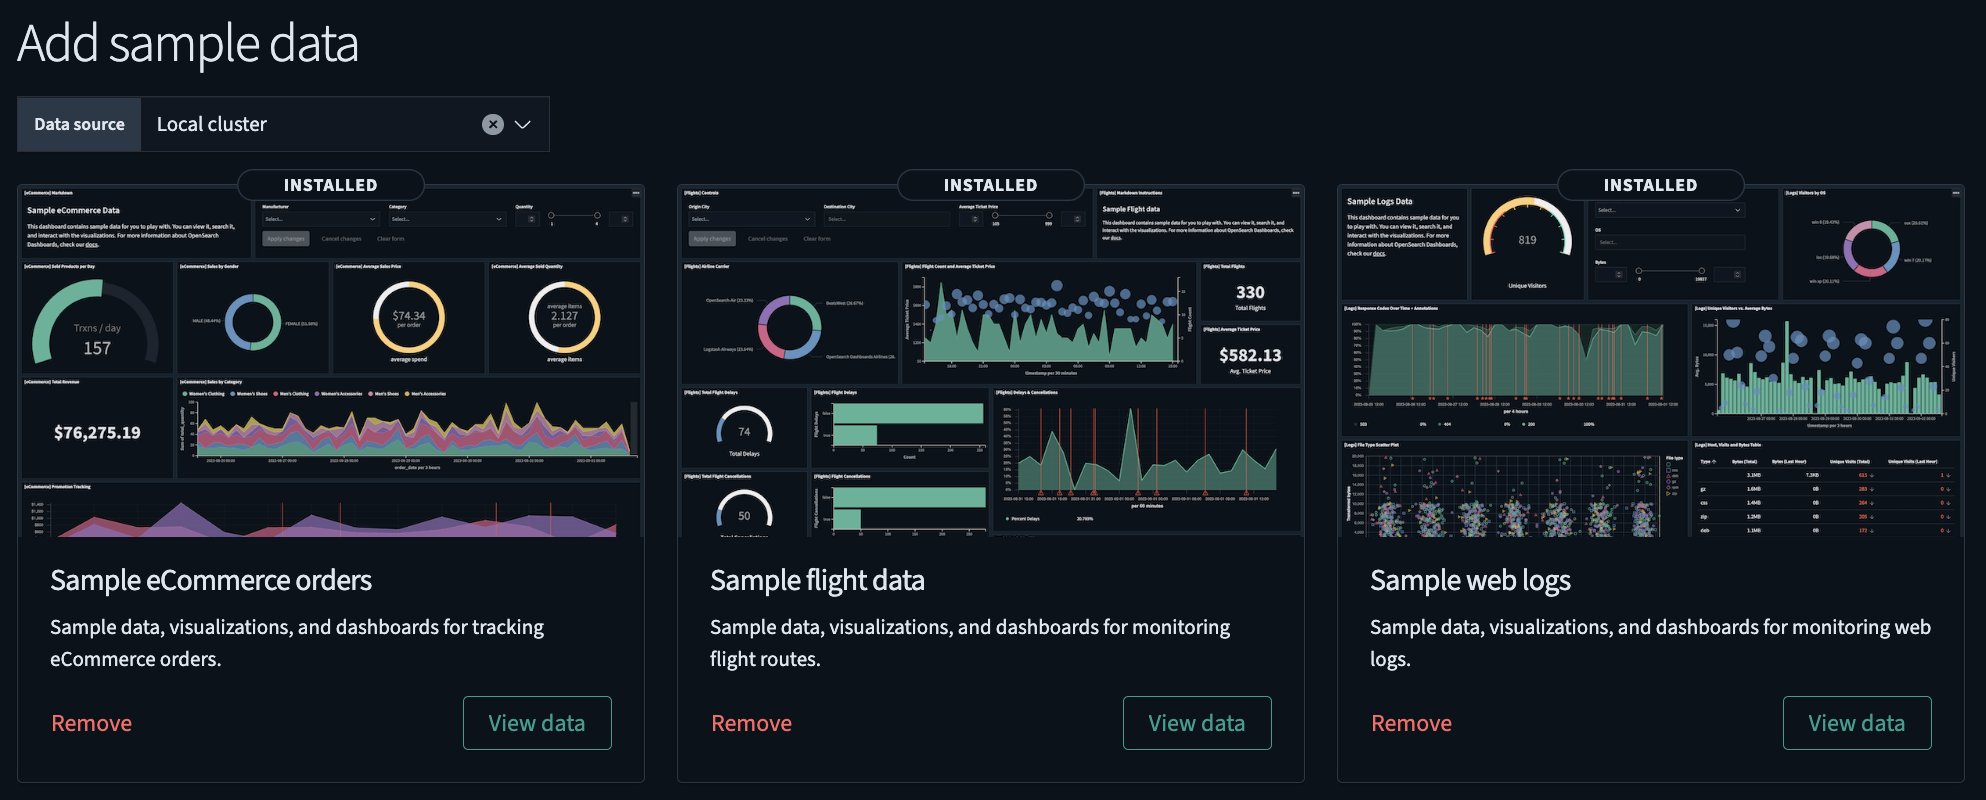
On the Add sample data page, select the Add data button in the Sample flight data tile and any others that you want to add.
The following image shows the available sample datasets.
Using the Discover tool
With Discover, you can:
- Choose data for analysis, set a time range for that data, search the data using Dashboards Query Language (DQL), and filter the results.
- Analyze your data: query and filter data, view results in a table, and examine documents.
- Create histograms to display the distribution of your data.
Follow these steps to use the Discover tool:
-
From the navigation panel, choose OpenSearch Dashboards > Discover.
-
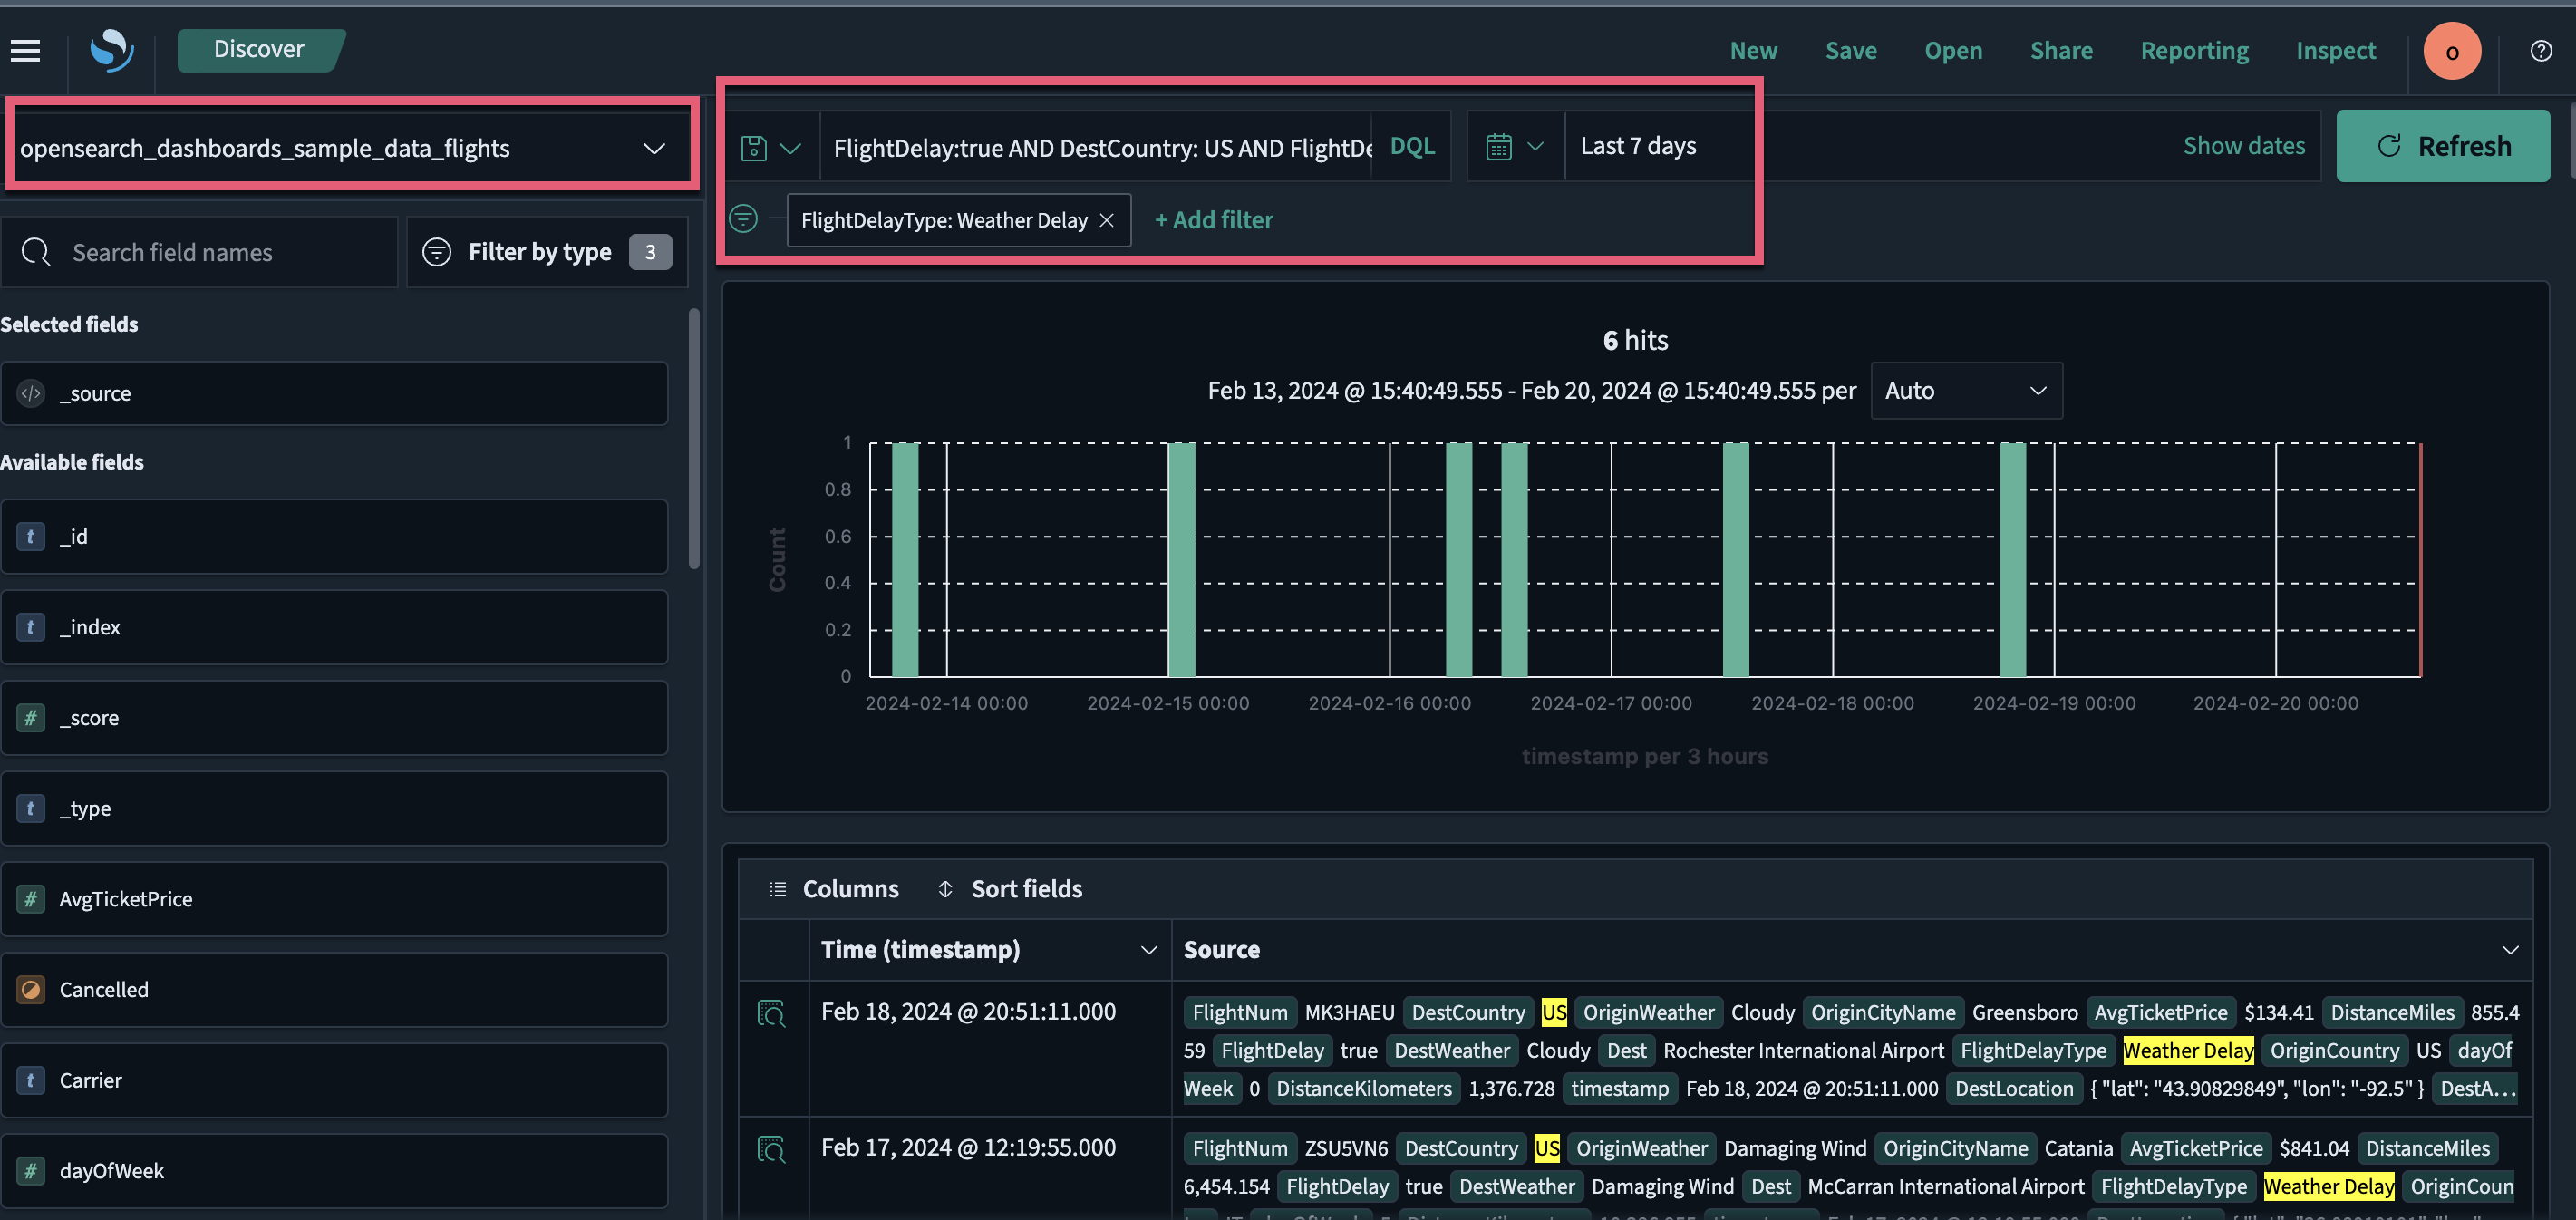
On the Discover page, choose the index pattern
opensearch_dashboards_sample_data_flightsfrom the dropdown menu on the upper left. -
Select the
 (calendar) icon to change the time filter from the default of Last 15 minutes to Last 7 days.
 -
In the DQL search bar, enter
FlightDelay:true AND DestCountry: US AND FlightDelayMin >= 60 -
Select Update.
Results are shown for US-bound flights delayed by 60 minutes or more.
-
Filter data by selecting
 (plus) Add filter from the DQL search bar and then selecting a Field, Operator, and Value from the dropdown lists in the Edit Filter popover. For example, select
 FlightDelayType, is, and Weather Delay. -
Select Save.
The resulting view is shown in the following image.
Using the Dashboards application
The Dashboards application creates and stores visualizations generated from your data.
With Dashboards, you can:
- Display multiple data visualizations in a single view.
- Build dynamic dashboards.
- Create and share reports.
- Embed analytics to differentiate your applications.
Follow these steps to use the application:
-
From the navigation panel, select OpenSearch Dashboards > Dashboards. The panel displays a list of existing dashboards.
-
In the search toolbar, search for and select [Flights] Global Flight Dashboard.
The panel displays a dashboard preloaded with visualizations, including charts, maps, and data tables.
-
To add other panels to the dashboard, select the Edit button and choose Add from the toolbar.
-
In the search toolbar in the Add panels window, enter
flights. -
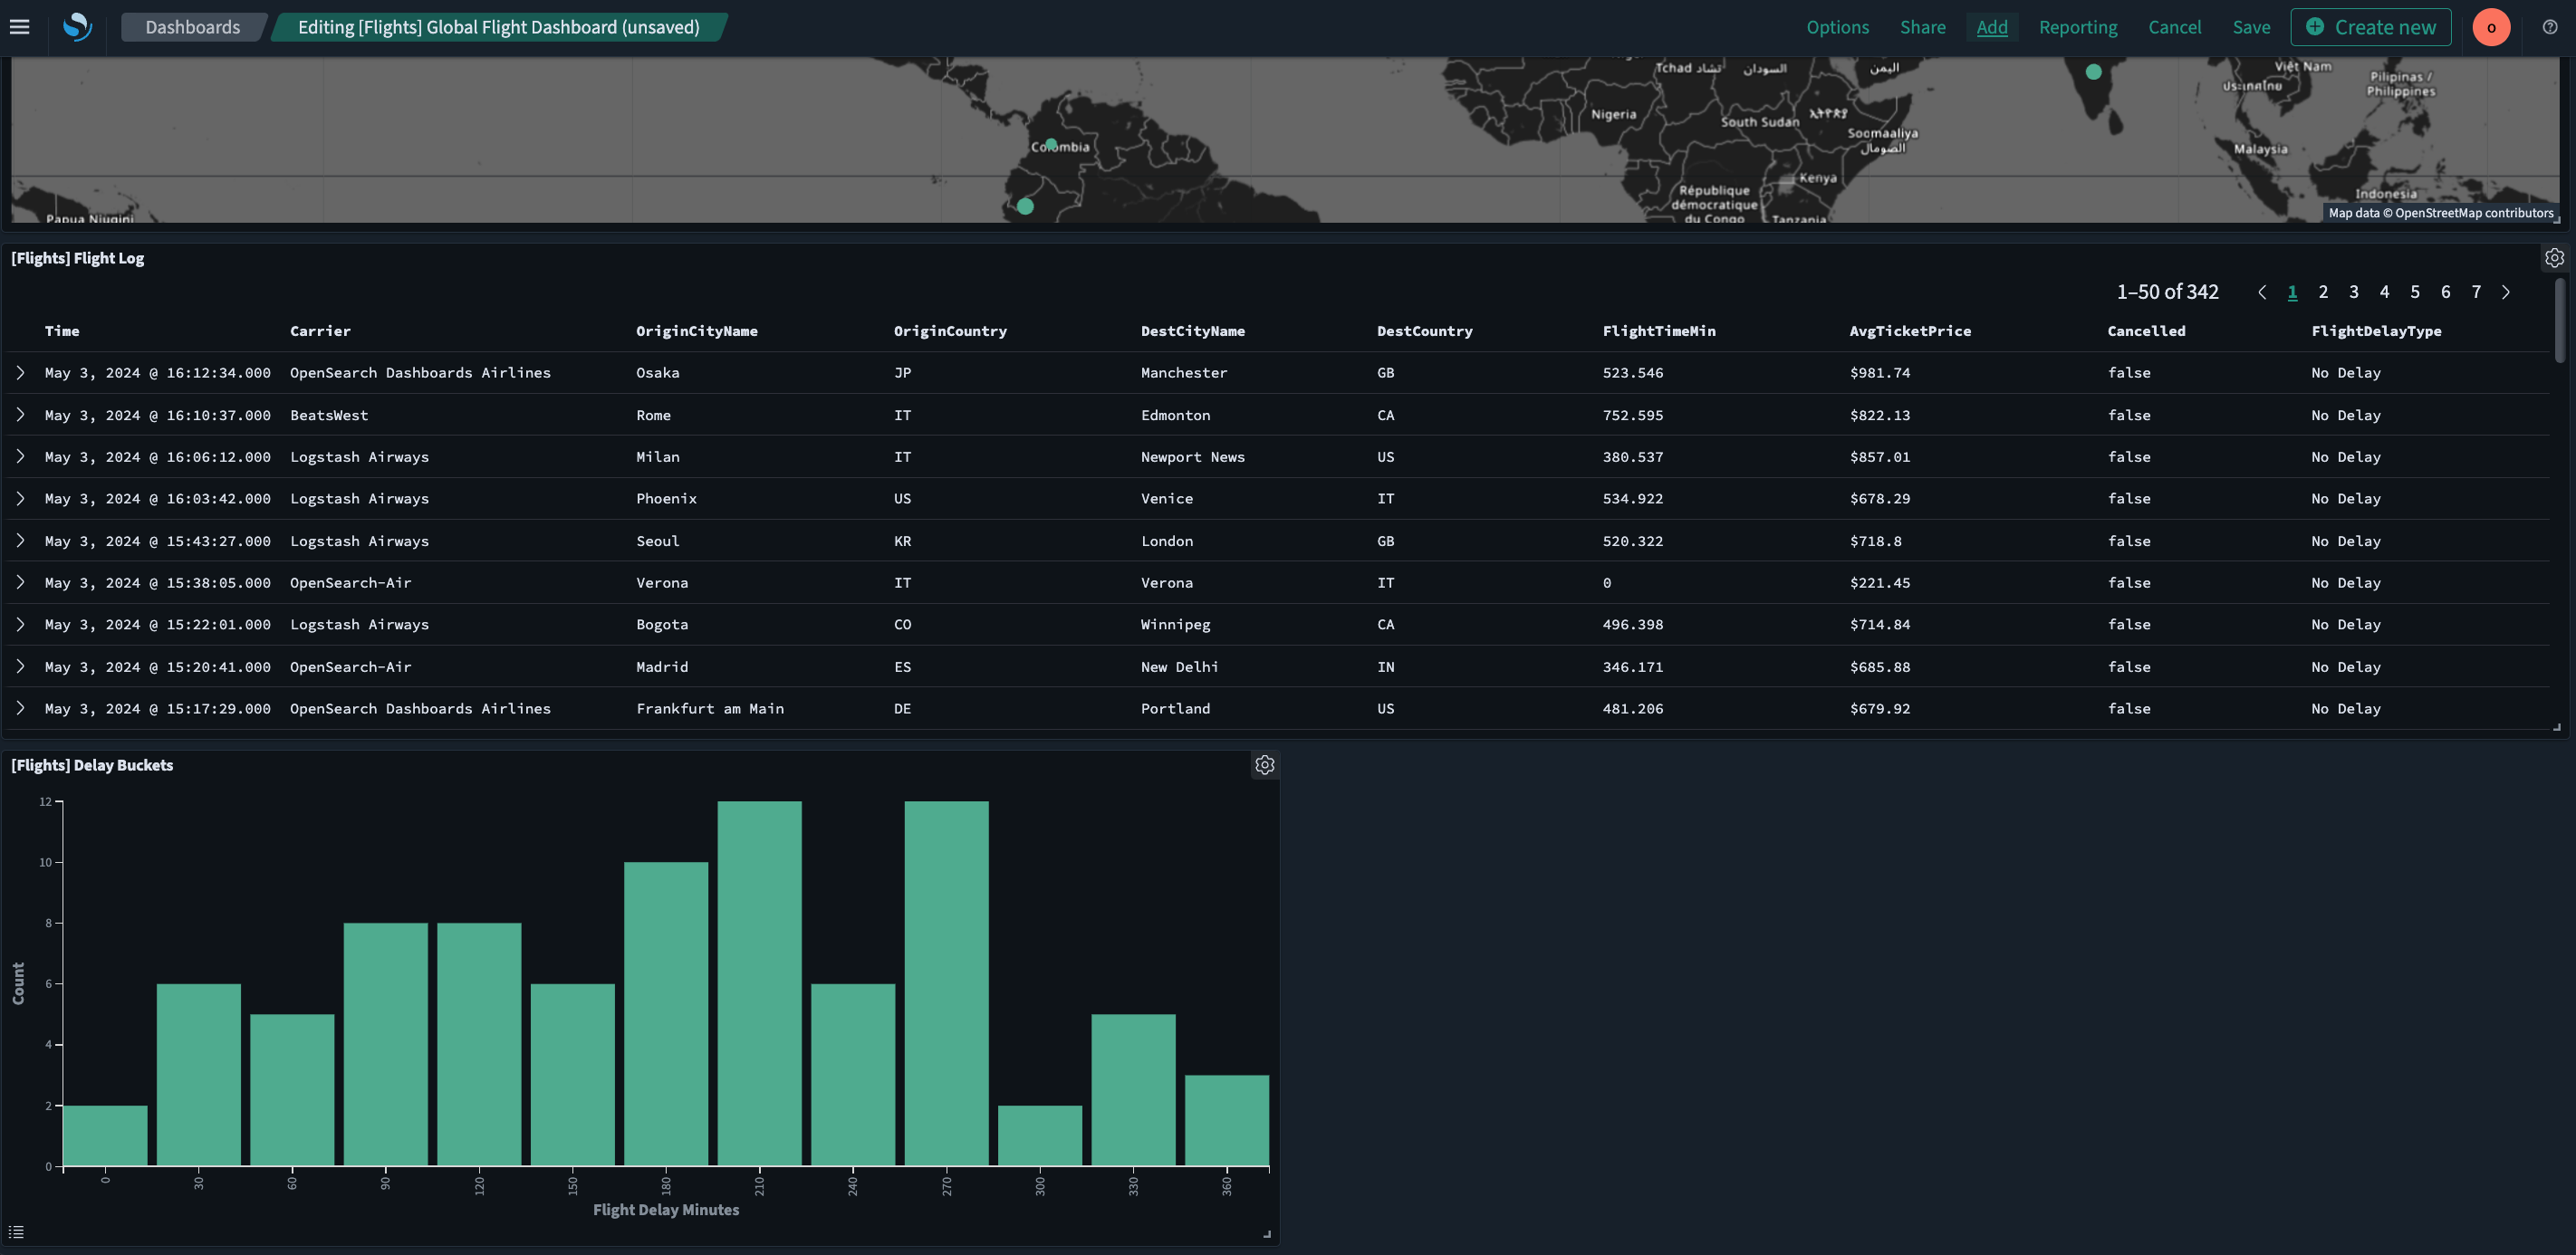
From the narrowed list, select [Flights] Delay Buckets.
-
Select
(cross) to exit the confirmation dialog. -
Select
(cross) to exit the Add panels window. -
Scroll down to confirm that the newly added panel is now displayed as the last panel on the dashboard.
The resulting view is shown in the following image.
For information about visualization types, see Building data visualizations. For information about using dashboards and visualizations in Observability, see Observability.
Filtering data in Dashboards
In Dashboards, you can interact with visualizations to filter data.
Using the [Flights] Global Flight Dashboard dashboard, follow these steps to further filter the sample flight data:
-
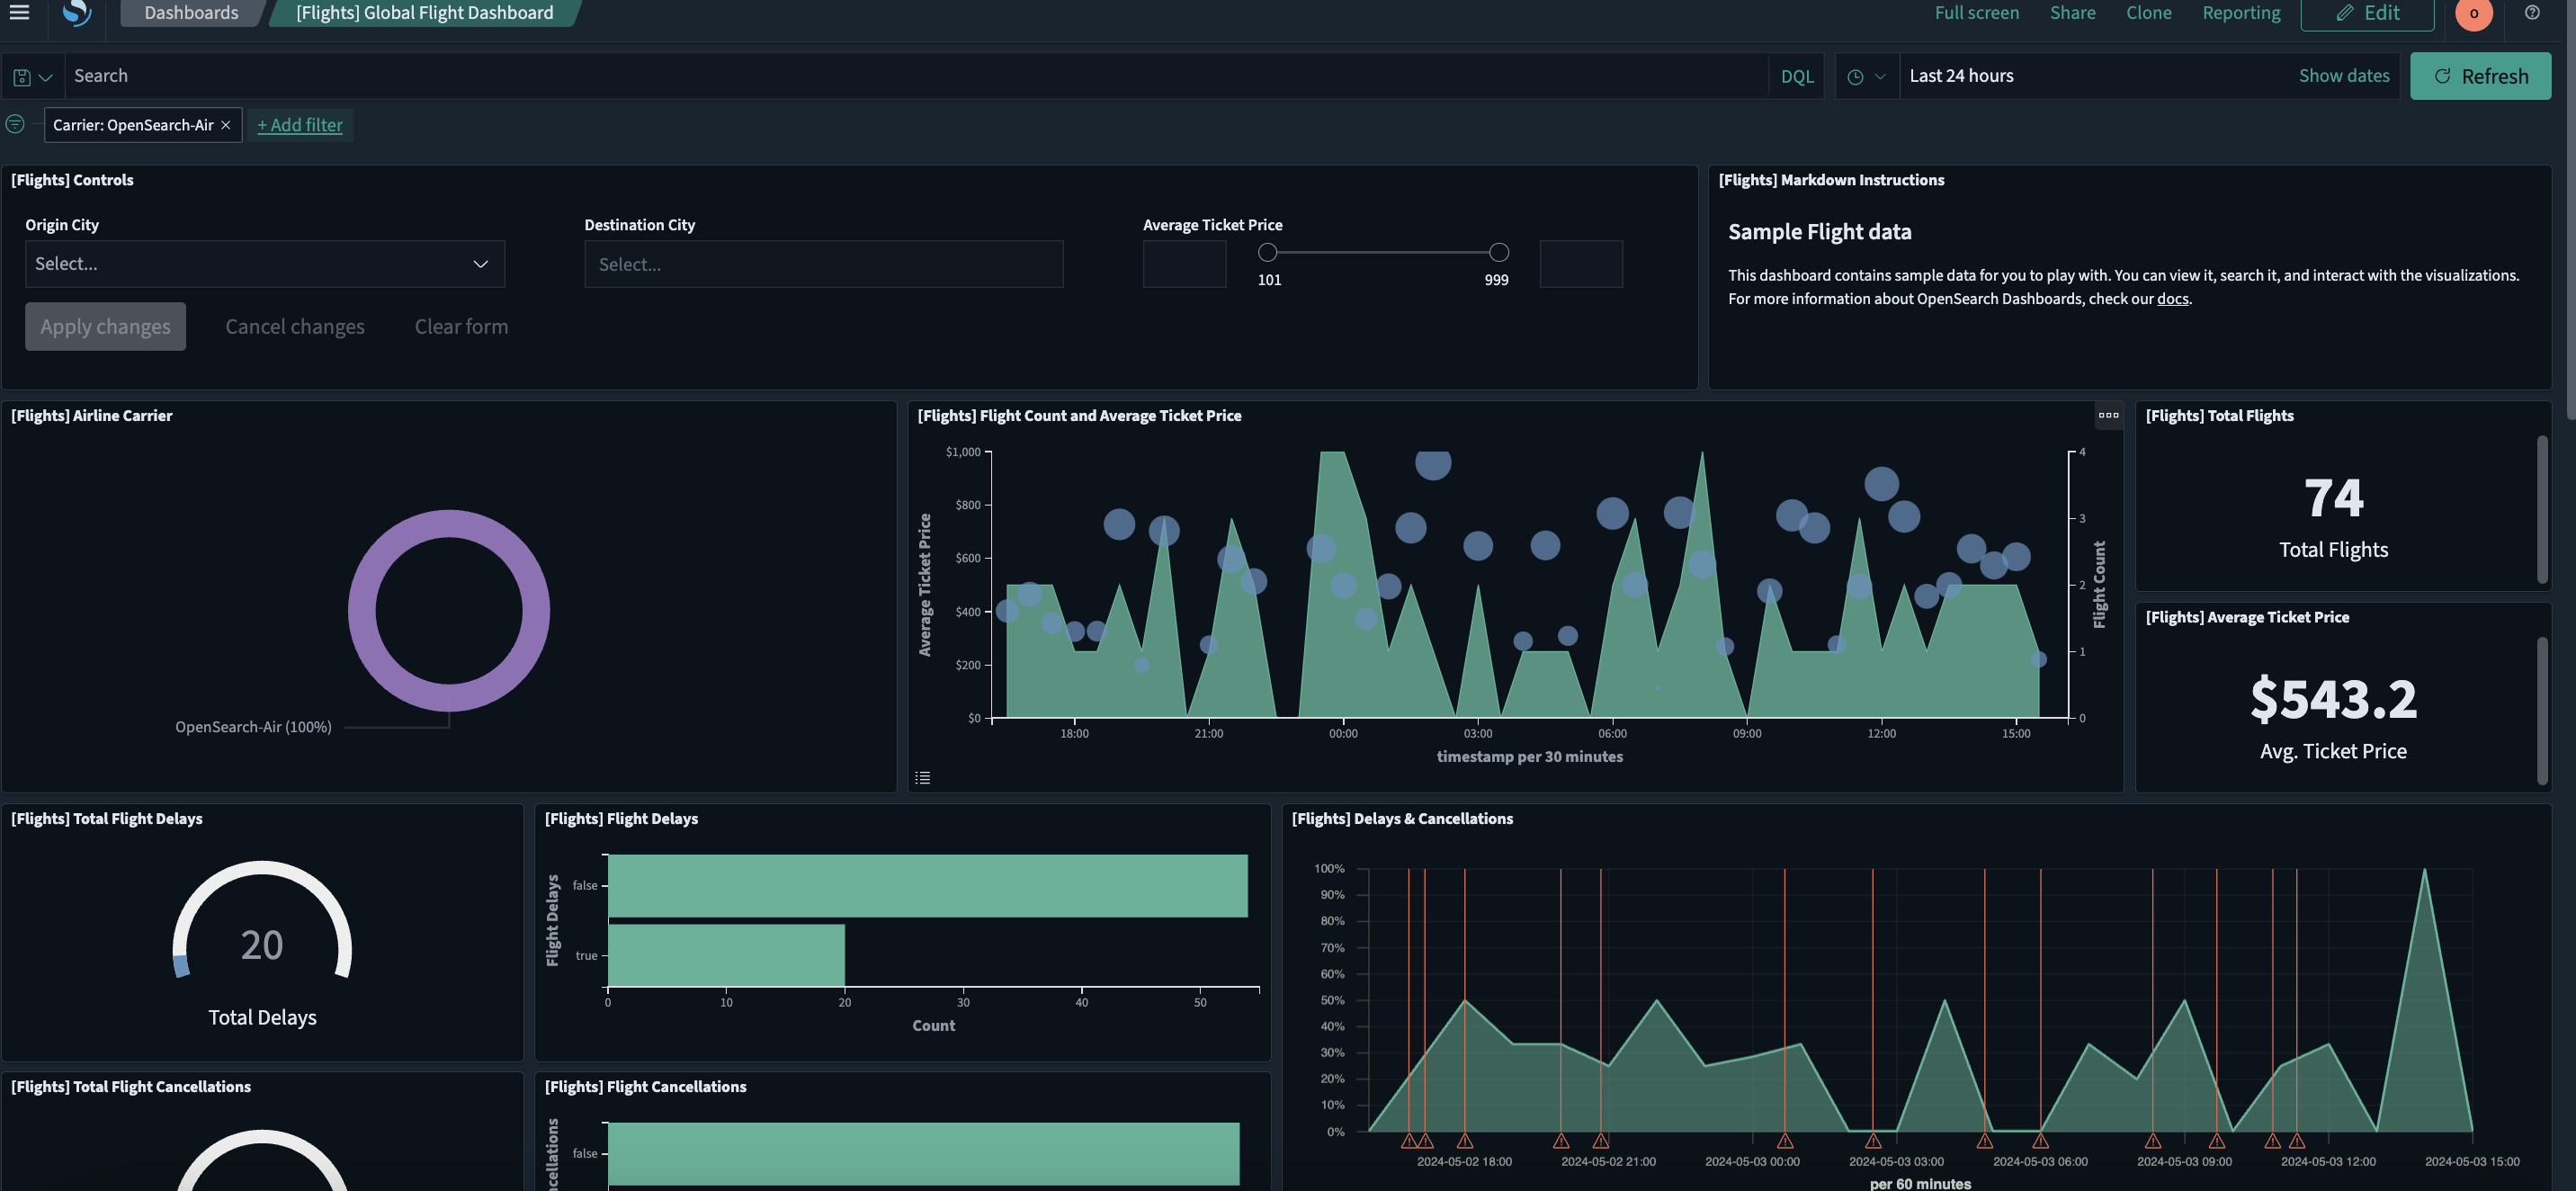
On the [Flights] Airline Carrier panel, choose OpenSearch-Air.
The dashboard updates automatically, adding the filter
Carrier: OpenSearch-Airto the upper-left filter bar, as shown in the following image.
-
Choose Save to save the dashboard.
Alternatively, you can use the dashboard toolbar to apply filters:
-
Select
(cross) in the Carrier: OpenSearch-Airfilter in the filter bar to remove the filter. -
In the dashboard toolbar, choose
(plus) Add filter. -
From the Field, Operator, and Value dropdown lists, choose Carrier, is, and OpenSearch-Air, respectively.
-
Choose Save.
The dashboard updates automatically.
The resulting view is shown in the following image.
Next steps
- To learn more about using Dashboards to analyze data, see Exploring data with Discover.
- To learn more about data visualizations, see Building data visualizations.
- To learn more about creating dashboards, see Creating dashboards.
- To learn more about data ingestion using OpenSearch, see Ingest APIs and Ingest pipelines.