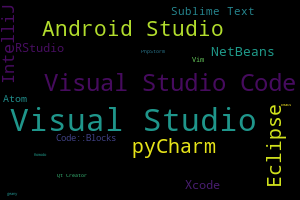
Top IDE index
The Top IDE Index is created by analyzing how often IDEs' download page are searched on Google
The more an IDE is searched, the more popular the IDE is assumed to be. The raw data comes from Google Trends.
If you believe in collective wisdom, the Top IDE index can help you decide which IDE to use for your software development project.
Worldwide, Apr 2026 :
| Rank | Change | IDE | Share | 1-year trend |
|---|---|---|---|---|
| 1 | Visual Studio | 24.44 % | -4.1 % | |
| 2 | Visual Studio Code | 12.2 % | -3.2 % | |
| 3 |  | Cursor | 12.07 % | +11.7 % |
| 4 |  | Android Studio | 9.85 % | -1.3 % |
| 5 | Eclipse | 8.88 % | -1.2 % | |
| 6 | | pyCharm | 6.2 % | -3.9 % |
| 7 | | IntelliJ | 5.71 % | -1.4 % |
| 8 | | Antigravity | 4.79 % | +4.8 % |
| 9 | | Xcode | 3.27 % | +0.3 % |
| 10 | | RStudio | 2.42 % | -0.4 % |
| 11 | | NetBeans | 2.37 % | -1.2 % |
| 12 | | Atom | 2.23 % | +0.3 % |
| 13 | | Sublime Text | 1.48 % | -0.9 % |
| 14 | | Code::Blocks | 1.26 % | -0.3 % |
| 15 | | Light Table | 0.85 % | +0.8 % |
| 16 | | Vim | 0.75 % | -0.1 % |
| 17 | | Komodo | 0.33 % | +0.2 % |
| 18 | | Emacs | 0.25 % | +0.0 % |
| 19 | | Qt Creator | 0.23 % | -0.1 % |
| 20 | | PhpStorm | 0.21 % | -0.1 % |
| 21 | | geany | 0.1 % | -0.0 % |
| 22 | | Xamarin | 0.04 % | +0.0 % |
| 23 | | Eric Python | 0.01 % | +0.0 % |
| 24 | | RAD Studio | 0.01 % | -0.0 % |
| 25 | | JDeveloper | 0.01 % | -0.0 % |
| 26 | | Aptana | 0.01 % | +0.0 % |
| 27 | | Coda 2 | 0.01 % | +0.0 % |
| 28 | | Monkey Studio | 0.0 % | +0.0 % |
| 29 | | JCreator | 0.0 % | -0.0 % |
| 30 | SharpDevelop | 0.0 % | +0.0 % | |
| 31 | | RubyMine | 0.0 % | +0.0 % |
| 31 | | Julia Studio | 0.0 % | +0.0 % |
| 33 | | MonoDevelop | 0.0 % | +0.0 % |
| 34 | | DrJava | 0.0 % | +0.0 % |
| © Pierre Carbonnelle, 2023 | ||||


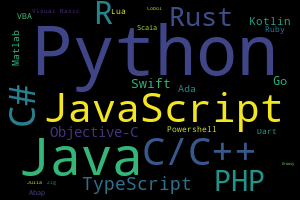
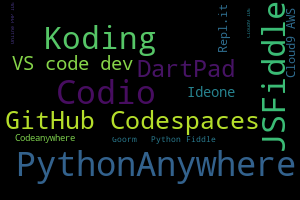
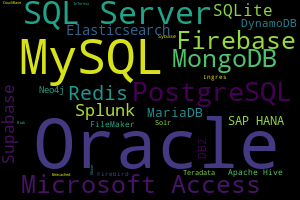
Please have a look at our other popularity indices :
FAQ
The Top IDE Index is created by analyzing how often Integrated Development Environment (IDE) downloads are searched on Google : the more an IDE is searched, the more popular the IDE is assumed to be. The raw data comes from Google Trends.
If you believe in collective wisdom, the TOP IDE Top IDE index can help you decide which IDE to use for your software development project.
The following principles were used:
- just the IDE name, e.g. Atom, would lead to inconsistent results, because Atom has many other meanings;
- the same search phrase should be used for all IDE, for consistency.
- the number of "download" search is a good leading indicator.
Some IDE are not listed because their name has other meanings, or because there is not enough data for them on Google Trends.
This work is licensed under a Creative Commons Attribution 3.0 Unported License.